After the industrial boom in UK fisheries following World War Two, the catch-per-unit effort started to decline in the 1960s. In the 1970s, the UK entered the European Market, which meant sharing access to its waters with European fleets and lost access to Icelandic waters following the ‘cod wars’. Little by little, as signs of overfishing became apparent, licenses and quotas started to be introduced. In particular, the herring fishery on the east coast of the UK, once renowned across Europe, came to a halt in the late 1970s through a fishing moratorium to save it from collapse.
Starting in the 1970s, formal licensing and quotas were introduced for different sectors and fleets, which progressively led to the downsizing of over-ten-metre fishing vessels. This meant that the so-called super-under-tens (under ten-metre vessels with high fishing capacity and power) escaped restrictions, leading to an increase in the ‘small scale’ fleet by the mid-1990s. A total of 11,000 vessels had been registered by 1995 (with over 7,000 smaller under ten-metre vessels). In the 1980s and 1990s, following a period of growth in the UK fishing industry, overcapacity policies were implemented to encourage fleet reduction through decommissioning. The EU’s Common Organisation of Markets also meant that quota entitlements started to be sold off with vessels to other EU Member States, further provoking a decline in fishing vessels. From a total of over 11,000 vessels in 1995, the number had declined to just over 6,000 vessels in 2015.
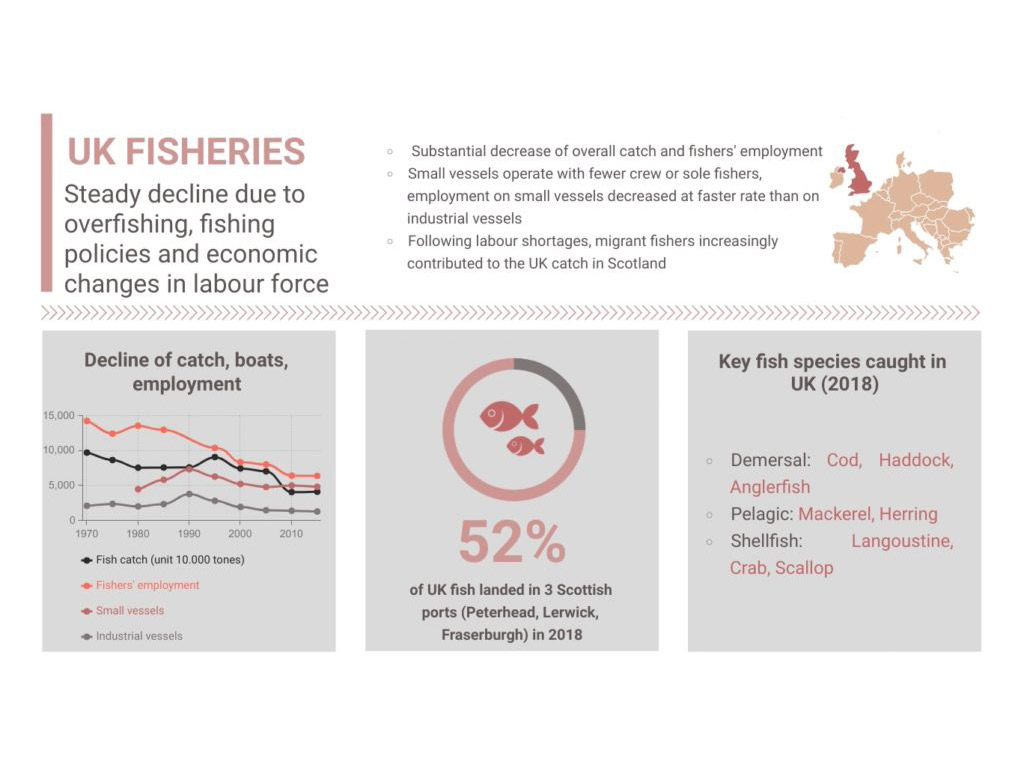
The total number of fishers employed in the sector also declined by over 50% between 1980 and 2010, from 13,590 in 1980 to 6,889 in 2010. Smaller boats accounted for a greater proportion of the total and required smaller crews and increased mechanisation of fishing, leading to many smaller boats operating with just one fisher. On Scottish over-ten-metre boats, there has been an increase in the number of migrant fishers employed on visas to meet the shortage of local crews.
Between 1993 and 1999, the total landings by weight for cod, haddock and whiting, the main whitefish species for UK vessels, accounted for 45% of landings by weight. Herring and mackerel accounted for 80% of landings by weight. Nephrops, crab, and scallops accounted for 75% of shellfish landings by weight. Overall, Scotland, particularly the east coast ports, accounted for 70% of the UK catch by weight.
Carole White